Why Some Streets Are Hotter Than Others In The Same City
Shade, surfaces, airflow, street shape and waste heat explain why one street feels hotter than another in the same city. Evidence from Malaysia, Singapore and elsewhere shows these factors change radiant and surface heat far more than air temperature. The article also explains how to compare streets fairly: matched times, shielded sensors and care with satellite heat maps.
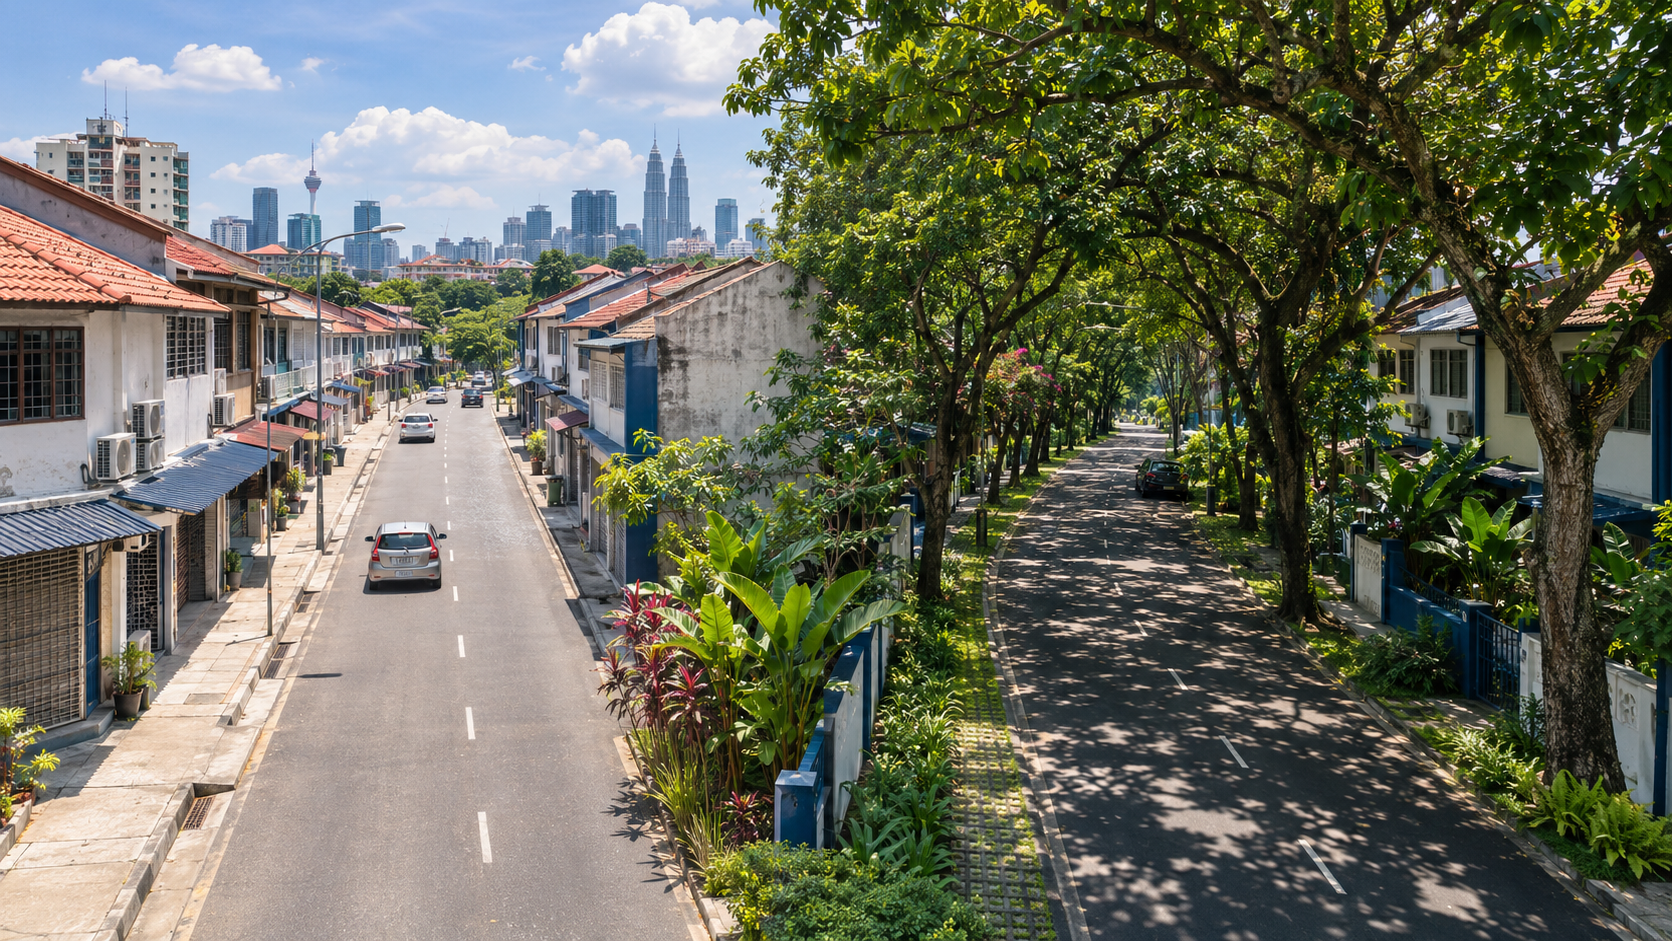
Imagine leaving a tree-lined road in Petaling Jaya and stepping onto a wide, open stretch of asphalt a few minutes' walk away. It is the same hour and the same forecast, yet the second street feels like the inside of an oven.
This explainer on street-level urban heat is for students, educators, city professionals and anyone who walks, cycles or waits for buses in a hot city. It explains why some streets are hotter than others in the same city, and how to tell whether a comparison between two streets is fair.
The short answer: shade, surfaces and airflow make most of the difference. The shape of the street and waste heat from buildings can add to that difference or reduce it.
There is also a common trap: many "hot street" comparisons mix up different kinds of temperature, and the kind you choose can change the answer.
Key idea: A thermometer measures the air. Your body measures the whole street.
The rest of the article follows what happens on a hot street, why it happens, how researchers collect the evidence, how to compare streets fairly and why heat at street level matters.
There is also a twist from Kuala Lumpur, where the place that is cooler by day becomes the warmer one after dark. We come back to it in Section 3.
Keep one idea in mind throughout: a city's "temperature" is not one number. Heat can differ from one street to the next, which is why the urban heat island is best understood street by street.
1. Which "hot" Do We Mean? Air, Surface, Radiant And Felt Temperature
When someone says a street is "hotter", they could mean any of four different measurements. They are related, but you cannot swap one for another.
- Air temperature: the reading from a shaded, ventilated thermometer about 1.25 to 2 m above the ground, which is the height range given in WMO urban observation guidance (WMO IOM Report No. 81, Oke 2006).
- Surface temperature: how hot the road, wall or roof itself is. Thermal cameras and satellites measure this.
- Mean radiant temperature: the total radiant heat reaching your body from direct sunlight and from hot surfaces around you. In plain language, it measures how much heat is landing on a person, whatever the air temperature is.
- Comfort indices such as PET: physiologically equivalent temperature combines air temperature, radiation, humidity and wind into a single "feels like" value for pedestrians.
Two streets can have almost the same air temperature but very different mean radiant temperature and PET. That is why the difference between air temperature vs surface temperature matters so much. A very hot road surface does not mean the air above it is equally hot, and neither number tells you on its own how a person standing there feels.
| Measure | What it captures | Typical tool | What it misses |
|---|---|---|---|
| Air temperature | Heat in the air around you | Shielded, ventilated sensor | Direct sun and radiant heat from surfaces |
| Surface temperature | Heat of the road, wall or roof | Thermal camera, satellite | What the air and your body experience |
| Mean radiant temperature | Radiant heat reaching a person | Globe thermometer or calculation | Wind and humidity effects |
| PET | Overall pedestrian comfort | Calculated from several inputs | Individual differences in clothing, activity and health |
The rest of this article shows which of these numbers shade, surfaces and airflow change most. The largest changes usually show up in radiant and surface heat, not in the air thermometer.
2. Shade And Street Trees: The Biggest And Simplest Difference
Blocking direct sunlight cuts the radiation that reaches people and pavement. That sounds obvious, but how big the effect looks depends on which temperature you measure.
A field study in Las Vegas found that street trees reduce outdoor heat exposure mainly by blocking sunlight. They lowered mean radiant temperature much more than they lowered air temperature (IOPscience).
So a shaded street can feel much cooler even when a thermometer shows only a small difference.
This is the key to understanding street trees and shade cooling. Most of the benefit comes from radiant heat that never reaches you, and an air thermometer is shielded so that it does not record that heat. Judge a tree only by the air temperature beneath it and you will underestimate it.
There is evidence from Malaysia too. Field measurements on tree-lined streets in Kuala Lumpur and Petaling Jaya found a mean surface temperature about 6.9°C lower under two rows of trees than with no shade (ResearchGate).
This is a single field observation from particular sites and conditions, not a fixed rule.
Now consider the opposite extreme. In Putrajaya, a planned tropical city, researchers found that mean radiant temperature in exposed low-rise areas exceeded 70°C (Academia.edu).
That is not the air temperature. It is the heat load that the sun and hot surfaces place on a body. The PET comfort index showed thermal discomfort lasting up to 8 hours a day in those areas.
Trees are not the only source of shade. Buildings cast shadows, and covered walkways, such as the five-foot ways along shophouse streets, give pedestrians continuous cover. None of the studies cited here measured these, so this article does not put numbers on them.
The people who feel shade, or the lack of it, most are pedestrians, outdoor workers and anyone waiting at an unshaded bus stop.
3. Street Shape And Direction: Canyons, Sky View And The Sun's Path
A street lined with buildings forms what researchers call a "street canyon". Its proportions and direction change how much sun reaches the ground, and for how long.
Height-to-width Ratio
Tall buildings along a narrow street shade the pavement for more of the day. Studies of street canyons in hot climates linked raising the height-to-width ratio (H/W) from about 1 to 3 with a PET drop of roughly 10°C (Sustainability, MDPI).
Sky View Factor
Sky view factor describes how much sky is visible from street level. A value near 1 means open sky, and lower values mean buildings or trees hide more of it. The same body of research linked a lower sky view factor with lower temperatures (Sustainability, MDPI). The logic behind sky view factor urban heat studies is simple: less visible sky by day means less direct sun reaching the street.
Street Canyon Orientation And Heat
The direction a street runs also matters. Reviews of street-canyon microclimate research found that east-west streets had higher air temperatures than north-south streets. One analysis ranked orientation (about 39%) slightly above aspect ratio (about 37%) as an influence on thermal comfort (IAFOR).
A simple way to picture why: on an east-west street, the sun moves along the street rather than across it. The buildings on either side therefore shade the pavement less for much of the day.
Researchers in Kuala Lumpur are asking the same questions. A study of four roads in the city treated both roadside tree cover and road orientation as factors behind the temperature differences between them (ResearchGate).
The Twist: Cooler By Day, Warmer By Night
Here is the twist promised earlier. Research on Kuala Lumpur reported a daytime "urban cool island" of about 4°C, attributed to shading by high-rise buildings, and a nighttime urban heat island of about 6°C (ScienceDirect). A common explanation is that dense building forms that shade a street by day also slow its cooling at night. Which place is "hotter" can depend on when you ask.
Uncertainty check: the weightings for orientation and aspect ratio come from one analysis. These effects also vary with climate zone, latitude and building materials.
4. Surfaces: How Asphalt And Cool Pavements Change Street Heat
Dark asphalt absorbs sunlight, stores the heat and releases it slowly, including after sunset. That is why a road can keep giving off warmth into the evening.
How hot can it get? In a pilot study in Arizona reported by the US EPA, the surface temperature of conventional asphalt reached up to 152°F (about 67°C) at midday. Cool pavements stayed 10 to 16°F (about 6 to 9°C) cooler (US EPA).
Surface Versus Air: What Reflective Pavements Change
This is where the four temperatures from Section 1 matter again. A systematic review of heat-reflective asphalt found that reflective pavements cool the surface by about 4.5 to 15°C but cool the air by only about 0.5 to 3.5°C (ScienceDirect). That gap is the central point in any comparison of cool pavement vs asphalt.
Surface measurements can exaggerate how much cooler the air becomes. A dramatic thermal photo of a pale road beside a dark one shows a real difference, but it is not a picture of the air you breathe.
Transferability caveat: the Arizona results come from a dry desert climate. It is uncertain how closely they apply to humid Southeast Asian streets.
| Surface | Effect on surface temperature | Effect on air temperature | Evidence base |
|---|---|---|---|
| Conventional dark asphalt | Up to about 67°C at midday (Arizona) | Baseline | EPA pilot |
| Cool or reflective pavement | About 4.5 to 15°C cooler | About 0.5 to 3.5°C cooler | Systematic review and EPA pilot |
| Surface under two rows of trees | About 6.9°C cooler than unshaded (KL and PJ) | Not reported in the cited study | Single field observation |
5. Airflow, Humidity And Waste Heat From Buildings
In humid tropical cities such as Kuala Lumpur and Singapore, wind deserves extra attention. Sweat evaporates less easily in humid air, so moving air does more of the work of carrying heat away from the body.
Studies of Singapore-style street canyons found that void decks, the open ground floors beneath buildings, let wind pass through and can roughly double wind speed at pedestrian level. Higher wind speed improves comfort by increasing convective heat loss from the body (ScienceDirect).
When Shade And Wind Pull In Opposite Directions
Research on Singapore summarised by ETH Zurich found that well-chosen vegetation in wind corridors can increase cooling. Dense canopies, though, can slow the wind and reduce cooling (ETH Zurich Future Resilient Systems). Heavy shade does not automatically make a humid street feel cooler.
This adds to the picture from Section 2. Shade and airflow can work against each other, so good street design means balancing the two, not simply adding more trees.
The Heat Buildings Push Out
A modelling study of downtown Singapore found that waste heat from buildings, mainly from air-conditioning, is a key driver of rising street air temperature. In the model, heat released at 100 W/m² could raise street air temperature by about 1.0°C (ScienceDirect). This is a model result, not a measurement taken on a street.
A possible feedback loop follows, although the studies here do not measure it directly. Hotter streets can lead to more air-conditioning use, which adds more waste heat to the street.
6. How To Measure Street Temperature Fairly
Before deciding why some streets are hotter than others, make sure the comparison is fair. Knowing how to measure street temperature properly matters as much as the reading itself. A careless method can create a difference that does not really exist.
Same Weather, Same Times
NOAA's community urban heat island mapping campaigns offer a useful model. Volunteers attach sensors to cars and record temperature, humidity, time and GPS location every second. They drive set routes in the morning, afternoon and evening on a hot, clear day (NOAA NIHHIS). As a result, every street is measured in the same weather and at the same times.
Shield And Ventilate The Sensor
WMO urban observation guidance calls for radiation shielding and ventilation, because sunlight reflected from walls, roads or shiny surfaces can distort readings. Sensors should sit about 1.25 to 2 m high. They should not be mounted directly over concrete or asphalt in a way that inflates readings (WMO IOM Report No. 81, Oke 2006).
Know What Satellite Heat Maps See
NASA Earthdata explains that satellite land surface temperature measures the surface urban heat island, which is different from the urban heat island measured in air temperature. Satellite sensors measure heat given off by surfaces, not the temperature of the air (NASA Earthdata).
A 2025 study, published as an arXiv preprint, goes further. It argues that satellite land surface temperature is a poor substitute for near-surface air temperature or for the heat people actually experience (arXiv). Comparing streets with thermal imagery alone can give a misleading picture of which one is hotter.
Measure What People Feel
Where possible, record radiant heat, humidity and wind alongside air temperature, and use a comfort index such as PET.
Repeat Across The Day And Night
Remember Kuala Lumpur: the ranking of two places can reverse between day and night.
A Checklist For A Fair Street Comparison
- Decide which temperature you are comparing: air, surface, radiant or comfort.
- Measure all streets on the same day, in the same weather.
- Take readings at matched times: morning, afternoon and evening.
- Use a shielded, ventilated sensor at about 1.25 to 2 m.
- Keep the sensor away from hot walls, car exhausts and air-conditioning outlets, unless those are what you are studying.
- Record humidity, wind, shade and surface type alongside each reading.
- Repeat on more than one day before drawing conclusions.
Common Pitfalls When Comparing Street Temperatures
- Reading a thermometer in direct sun.
- Comparing a 2 pm reading with a 5 pm reading.
- Treating a thermal photo of a road as the air temperature.
- Relying on a single day.
- Drawing conclusions about a whole street from one corner.
7. Street Heat Evidence: What Is Established, Uncertain And Emerging
Established
- Shade lowers mean radiant temperature and surface temperature much more than it lowers air temperature, as shown in Las Vegas and in Kuala Lumpur and Petaling Jaya.
- Surface temperature, air temperature and felt heat are different quantities, as NASA, WMO guidance and the pavement systematic review all show.
- The way you measure affects the result, including sensor shielding, height and timing, as WMO guidance and NOAA's campaigns make clear.
Uncertain
- The size of these effects varies by city and climate. Many results come from single sites, specific climates or models.
- The relative weight of orientation versus aspect ratio comes from one analysis.
- It is unclear how well the Arizona pavement results apply to humid tropical cities.
- Several of the Malaysian findings cited here were accessed through research repositories. They are best read as field observations, not general rules.
Emerging
- How to balance shade and ventilation in humid cities, as in the Singapore research on vegetation and wind.
- How much waste heat from air-conditioning contributes at street level, which so far is based on modelling.
- Critiques of satellite land surface temperature as a stand-in for the heat people experience, including the 2025 preprint.
8. Why Street-scale Heat Matters And How Cities Respond
Heat exposure varies from street to street, not just from city to city. The people most exposed include those who walk, cycle, work outdoors or wait for public transport. For them, the street they are on matters more than the city average in a forecast.
Cities and researchers are discussing several types of response:
- Planting street trees and providing continuous shade, including covered walkways.
- Considering orientation, canyon proportions and sky view when designing new districts.
- Using cooler surface materials, while recognising that air temperature changes less than surface temperature.
- Keeping ventilation paths open, for example with void decks or by choosing vegetation that does not block breezes.
- Reducing waste heat from buildings, or moving where it is released.
Each response has trade-offs:
- Deep street canyons can trap heat at night.
- Dense tree canopies can block wind.
- Reflective surfaces change surface temperature more than air temperature.
You do not need to act on any of this to benefit from it. Understanding it lets you read heat maps and headlines more critically by asking which temperature was measured, when and how.
Conclusion: Reading Street Heat, Not Just The Forecast
Shade, street shape, surfaces, airflow and waste heat combine differently on every street. The choice of measurement also shapes the conclusion. A thermal photo, a weather station and a pedestrian's skin can each tell a different story about the same street.
The answer to why some streets are hotter than others usually depends on radiant heat and airflow, not just on what the air thermometer shows.
Next time you step from shade into sun, notice the change and think about which temperature caused it. When a heat map appears in the news, check whether it shows surfaces or air, and when the data were collected. To see what a careful street-by-street survey looks like, NOAA's Urban Heat Island Mapping Campaigns page is a good place to start.
Frequently Asked Questions About Hot Streets
Why Can A Road Feel Hotter Than The Thermometer Says?
A properly shielded thermometer measures the air and is designed to exclude direct sun. Your body also absorbs radiant heat from the sun and from hot surfaces, which is what mean radiant temperature describes. In Las Vegas, street trees lowered mean radiant temperature much more than air temperature. In other words, radiant heat accounts for much of the difference you feel (IOPscience).
Are Satellite Heat Maps Accurate For Comparing Streets?
They are accurate about what they measure, which is how hot surfaces are. NASA Earthdata notes that satellite land surface temperature describes the surface urban heat island, not the air. A 2025 study argues that it is a poor substitute for the heat people experience (NASA Earthdata; arXiv).
Do More Trees Always Make A Street Cooler?
Not always, especially in humid cities. Research on Singapore summarised by ETH Zurich found that dense canopies can slow the wind and reduce cooling. Well-placed vegetation in wind corridors can improve it (ETH Zurich Future Resilient Systems).
Are High-rise Streets Hotter Or Cooler?
It depends on the time of day. Research on Kuala Lumpur reported a daytime cool island of about 4°C from high-rise shading and a nighttime heat island of about 6°C (ScienceDirect).
Sources
- Effectiveness of street trees in reducing air temperature and outdoor heat exposure in Las Vegas (IOPscience)
- Effects of Roadside Trees and Road Orientation on Thermal Environment in a Tropical City (ResearchGate)
- Field Observation on Thermal Environment of an Urban Street with Roadside Trees in a Tropical Climate (ResearchGate)
- Urban heat island and thermal comfort conditions at micro-climate scale in a tropical planned city (Academia.edu)
- Urban heat island in the modern tropical Kuala Lumpur: Comparative weight of the different parameters (ScienceDirect)
- Achieving Effective Thermal Performance of Street Canyons in Various Climatic Zones (Sustainability, MDPI)
- Assessment of Thermal Comfort and Microclimate in Urban Street Canyons (IAFOR)
- Using Cool Pavements to Reduce Heat Islands (US EPA)
- Effectiveness of heat-reflective asphalt pavements in mitigating urban heat islands: A systematic literature review (ScienceDirect)
- Initial Guidance to Obtain Representative Meteorological Observations at Urban Sites, WMO IOM Report No. 81 (Oke, 2006)
- Detecting Urban-Rural Temperature Differences with MODIS and AppEEARS (NASA Earthdata)
- Satellite-derived Land Surface Temperatures Strongly Mischaracterise urban heat (arXiv)
- Urban Heat Island Mapping Campaigns (NOAA NIHHIS)
- Can urban vegetation help cool Singapore? (ETH Zurich Future Resilient Systems)
- Analytical and numerical study on transient urban street air warming induced by anthropogenic heat emission (ScienceDirect)
- Pedestrian-level wind speed enhancement in urban street canyons with void decks (ScienceDirect)